Dogecoin (DOGE) Recovery Sees Uptick — But Lacks Follow‑Through at $0.168


Dogecoin started a fresh increase above the $0.160 zone against the US Dollar. DOGE is now consolidating and might aim for a move above $0.1680.
- DOGE price started a fresh increase above the $0.1520 and $0.160 levels.
- The price is trading above the $0.1620 level and the 100-hourly simple moving average.
- There is a key bullish trend line forming with support at $0.1650 on the hourly chart of the DOGE/USD pair (data source from Kraken).
- The price could start a fresh decline if it stays below the $0.1680 zone.
Dogecoin Price Faces Resistance
Dogecoin price started a fresh increase above the $0.1450 zone, like Bitcoin and Ethereum . DOGE was able to climb above the $0.1550 and $0.160 resistance levels.
The bulls even pushed the price above the $0.1650 resistance. A high was formed at $0.1699 and the price is now consolidating gains above the 23.6% Fib retracement level of the upward move from the $0.1572 swing low to the $0.1699 high.
Dogecoin price is now trading above the $0.1650 level and the 100-hourly simple moving average. There is also a key bullish trend line forming with support at $0.1650 on the hourly chart of the DOGE/USD pair.
Immediate resistance on the upside is near the $0.1680 level. The first major resistance for the bulls could be near the $0.1720 level. The next major resistance is near the $0.1750 level. A close above the $0.1750 resistance might send the price toward the $0.180 resistance. Any more gains might send the price toward the $0.200 level. The next major stop for the bulls might be $0.2120.
Another Drop In DOGE?
If DOGE’s price fails to climb above the $0.1680 level, it could start another decline. Initial support on the downside is near the $0.1660 level or the trend line zone. The next major support is near the $0.1620 level and the 61.8% Fib retracement level of the upward move from the $0.1572 swing low to the $0.1699 high.
The main support sits at $0.160. If there is a downside break below the $0.160 support, the price could decline further. In the stated case, the price might decline toward the $0.150 level or even $0.1450 in the near term.
Technical Indicators
Hourly MACD – The MACD for DOGE/USD is now losing momentum in the bullish zone.
Hourly RSI (Relative Strength Index) – The RSI for DOGE/USD is now above the 50 level.
Major Support Levels – $0.1650 and $0.1620.
Major Resistance Levels – $0.1680 and $0.1800.
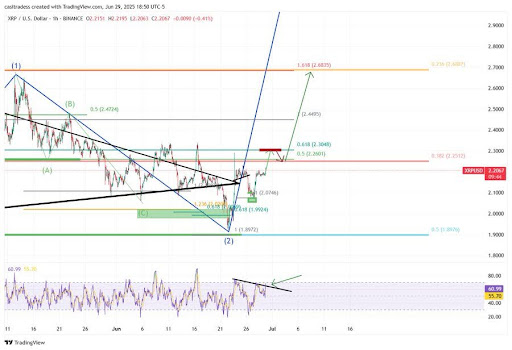
XRP Reacts Powerfully After Precise Touch Of The $2.07 Fib Zone
XRP showed a powerful technical reaction after dipping precisely to the $2.07 Fib confluence zone, w...

South Korea Pauses CBDCs, Stablecoins Heat Up: Here’s Why Best Wallet Wins the New Crypto Framework
South Korea pressed pause on its central bank digital currency (CBDC) initiative, even as its new go...
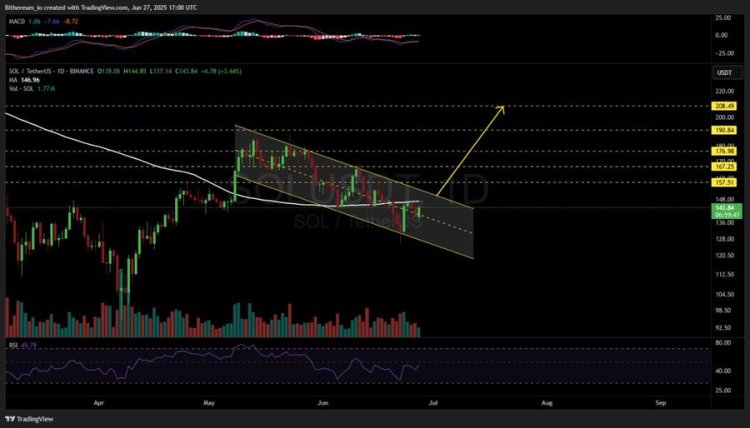
Solana Forms Bullish Flag On Daily Chart — Breakout Imminent?
Solana is displaying signs of strength as it trades with a key chart pattern, which indicates that t...